Incidents
Incidents are critical entities in incident management workflows. They represent a service disruption or outage that needs to be restored urgently. GitLab provides tools for the triage, response, and remediation of incidents.
Users with at least Guest permissions can access incidents on public projects.
Incident Creation
You can create an incident manually or automatically.
Create incidents manually
If you have at least Guest permissions, to create an Incident, you have two options to do this manually.
From the Incidents List:
Moved to GitLab Free in 13.3.
- Navigate to Monitor > Incidents and click Create Incident.
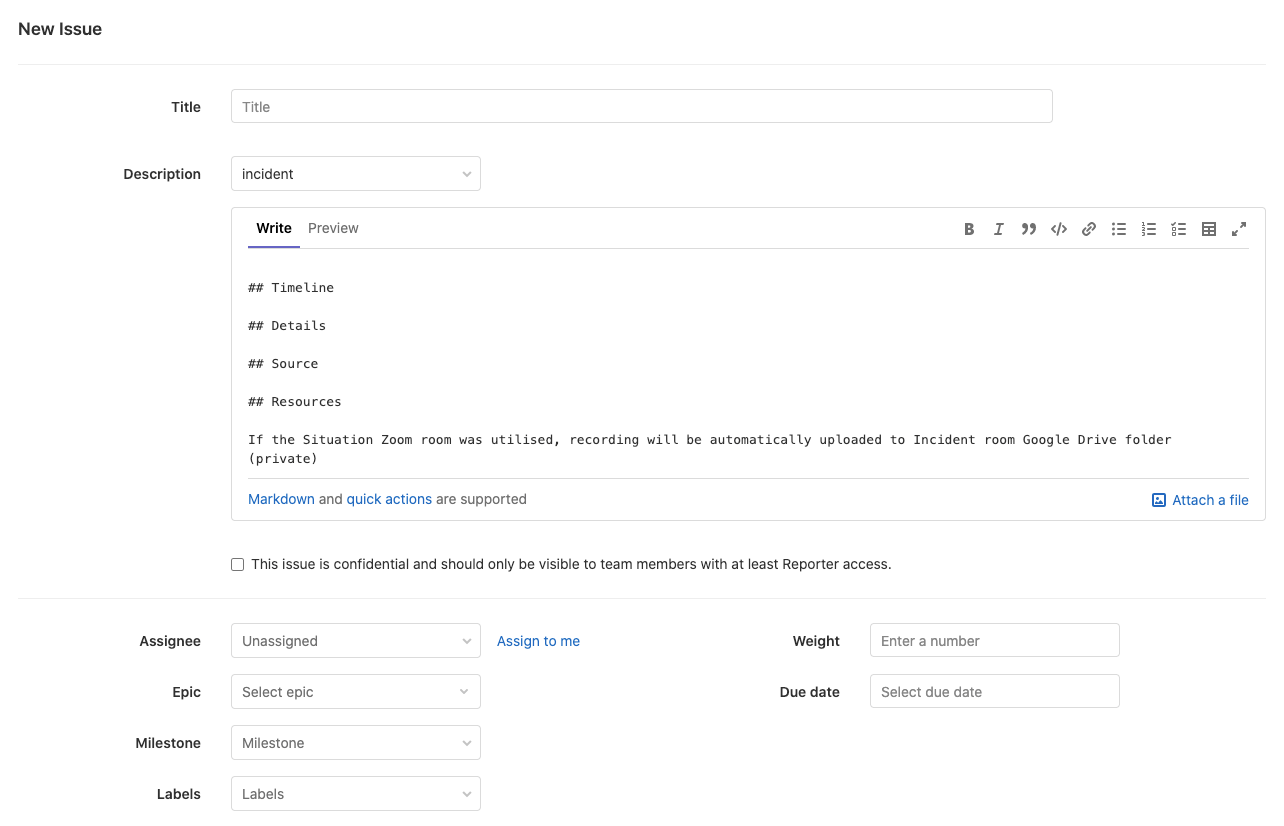
- Create a new issue using the
incidenttemplate available when creating it. - Create a new issue and assign the
incidentlabel to it.
From the Issues List:
Introduced in GitLab 13.4.
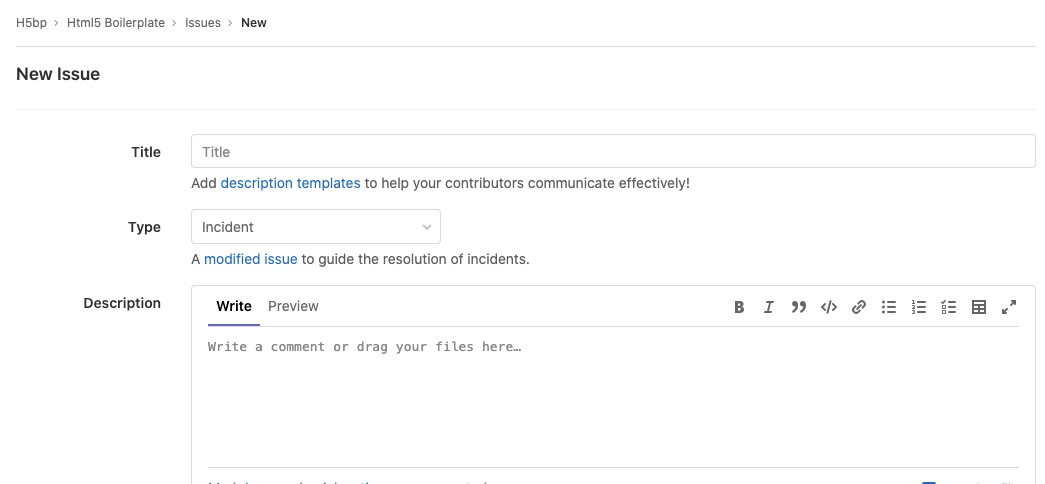
- Go to Issues > List, and select New issue.
- In the Type dropdown, select Incident. Only fields relevant to incidents are displayed on the page.
- Create the incident as needed, and select Create issue to save the incident.
Create incidents automatically
Introduced in GitLab Ultimate 11.11.
With Maintainer or higher permissions, you can enable GitLab to create incident automatically whenever an alert is triggered:
- Navigate to Settings > Monitor > Incidents and expand Incidents.
- Check the Create an incident checkbox.
- To customize the incident, select an issue template.
- To send an email notification to users with Developer permissions, select Send a separate email notification to Developers. Email notifications are also sent to users with Maintainer and Owner permissions.
- Click Save changes.
Create incidents via the PagerDuty webhook
Introduced in GitLab 13.3.
You can set up a webhook with PagerDuty to automatically create a GitLab incident for each PagerDuty incident. This configuration requires you to make changes in both PagerDuty and GitLab:
- Sign in as a user with the Maintainer role.
- Navigate to Settings > Monitor > Incidents and expand Incidents.
-
Select the PagerDuty integration tab:
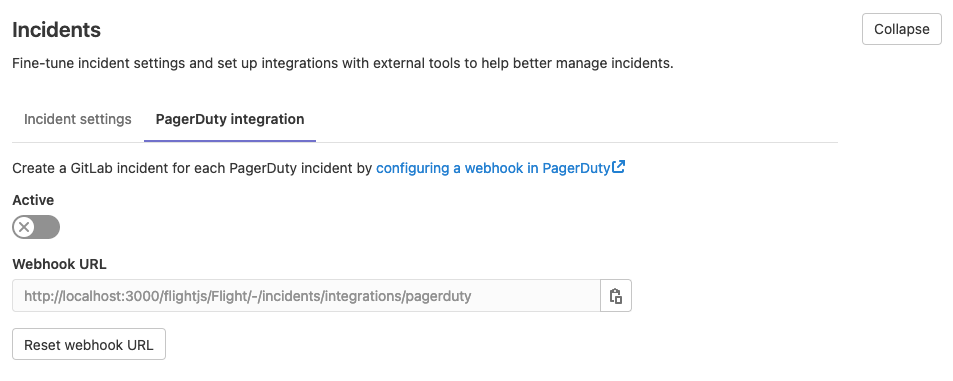
- Activate the integration, and save the changes in GitLab.
- Copy the value of Webhook URL for use in a later step.
- Follow the steps described in the PagerDuty documentation to add the webhook URL to a PagerDuty webhook integration.
To confirm the integration is successful, trigger a test incident from PagerDuty to confirm that a GitLab incident is created from the incident.
Incident list
For users with at least Guest permissions, the Incident list is available at Monitor > Incidents in your project’s sidebar. The list contains the following metrics:
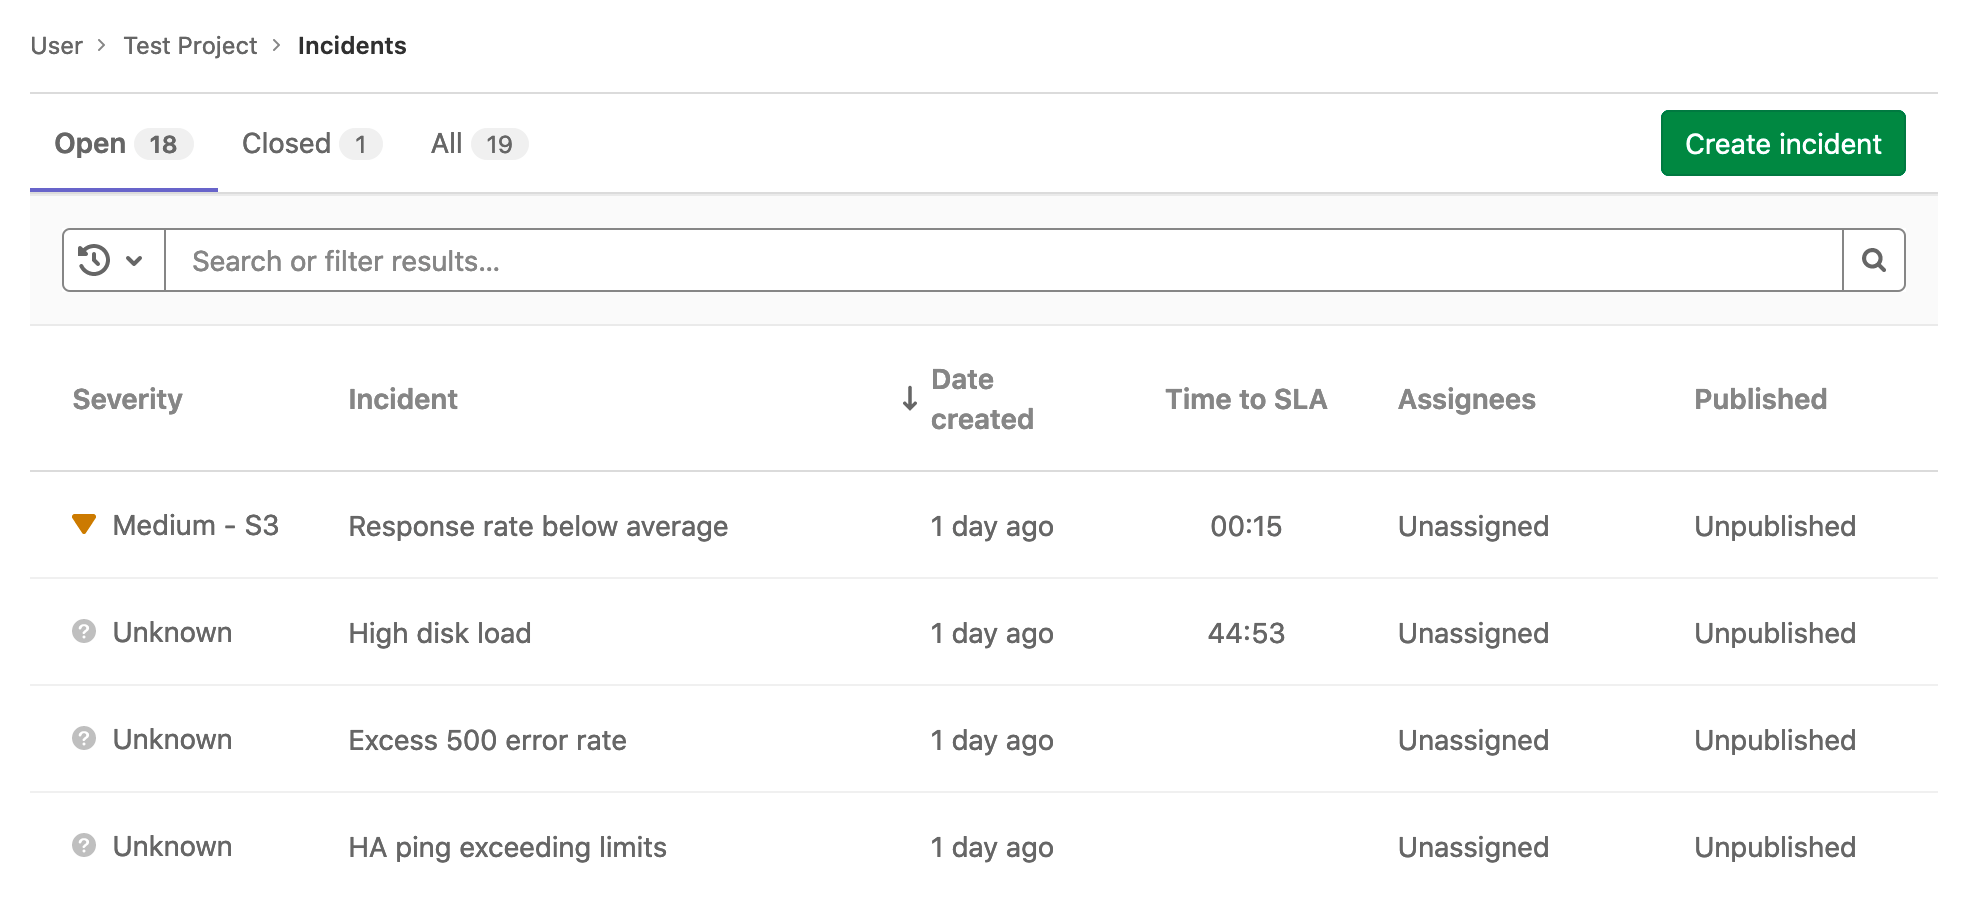
- Status - To filter incidents by their status, click Open, Closed, or All above the incident list.
- Search - The Incident list supports a simple free text search, which filters on the Title and Incident fields.
-
Severity - Severity of a particular incident, which can be one of the following
values:
- Critical - S1
- High - S2
- Medium - S3
- Low - S4
- Unknown
Editing incident severity on the incident details page was introduced in GitLab 13.4.
- Incident - The description of the incident, which attempts to capture the most meaningful data.
-
Date created - How long ago the incident was created. This field uses the
standard GitLab pattern of
X time ago, but is supported by a granular date/time tooltip depending on the user’s locale. - Assignees - The user assigned to the incident.
- Published - Displays a green check mark () if the incident is published to a Status Page.
The Incident list displays incidents sorted by incident created date. (Introduced to GitLab Free in 13.3.) To see if a column is sortable, point your mouse at the header. Sortable columns display an arrow next to the column name.
Incidents share the Issues API.
Incident details
Introduced in GitLab 13.4.
Users with at least Guest permissions can view the Incident Details page. Navigate to Monitor > Incidents in your project’s sidebar, and select an incident from the list.
When you take any of these actions on an incident, GitLab logs a system note and displays it in the Incident Details view:
- Updating the severity of an incident (Introduced in GitLab 13.5.)
For live examples of GitLab incidents, visit the tanuki-inc project’s
incident list page.
Click any incident in the list to display its incident details page.
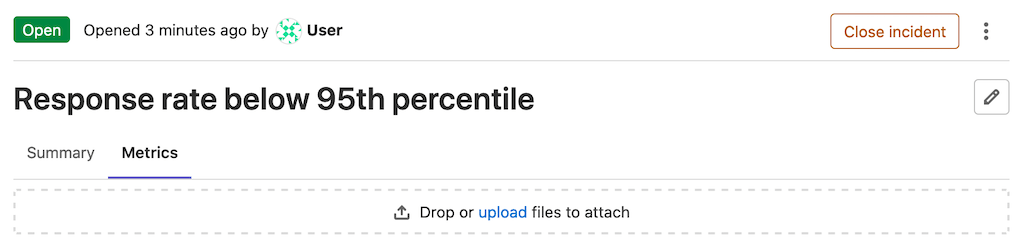
Summary
The summary section for incidents provides both critical details about and the contents of the issue template (if one was used). The highlighted bar at the top of the incident displays from left to right:
- The link to the original alert.
- The alert start time.
- The event count.
Beneath the highlight bar, GitLab displays a summary that includes the following fields:
- Start time
- Severity
full_query- Monitoring tool
Comments are displayed in threads, but can be displayed chronologically in a timeline view.
Metrics
Introduced in GitLab Premium 13.8.
In many cases, incidents are associated to metrics. You can upload screenshots of metric charts in the Metrics tab:
When you upload an image, you can associate it with a URL to the original graph. Users can access the original graph by clicking the image:

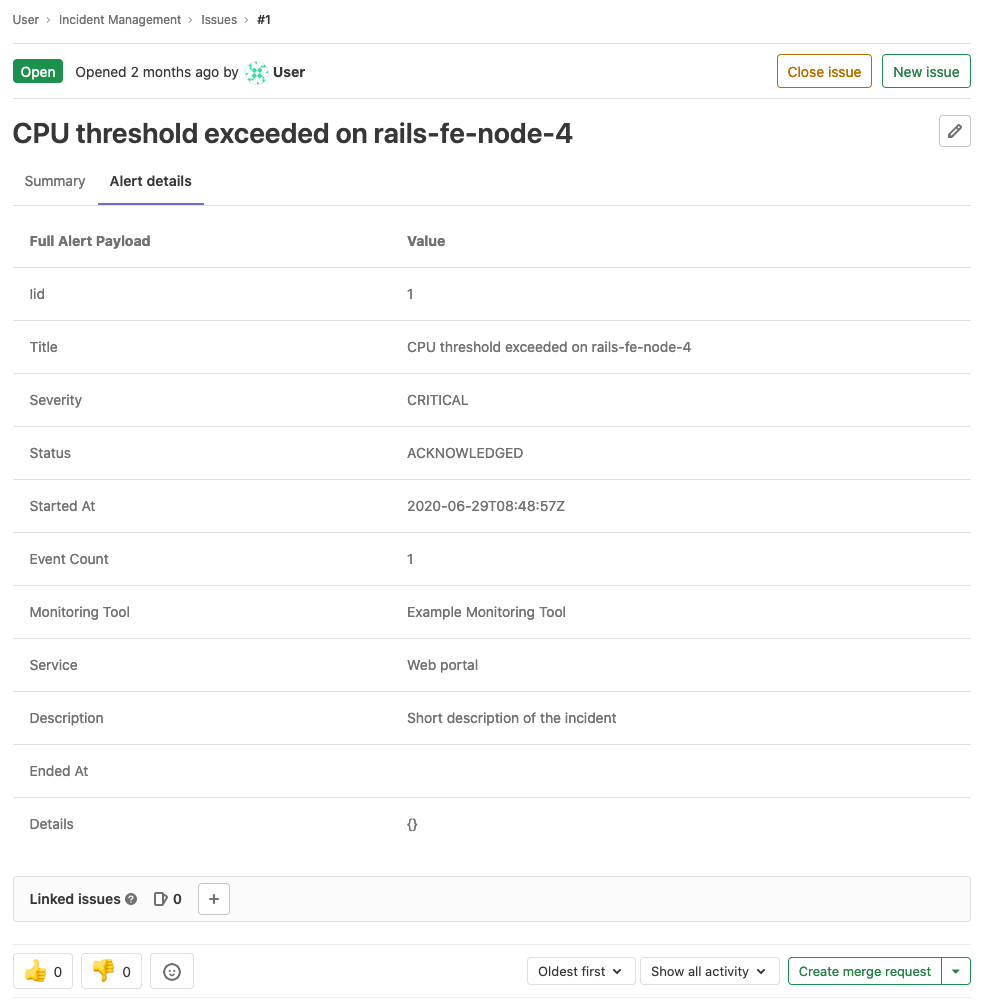
Alert details
Incidents show the details of linked alerts in a separate tab. To populate this tab, the incident must have been created with a linked alert. Incidents created automatically from alerts have this field populated.
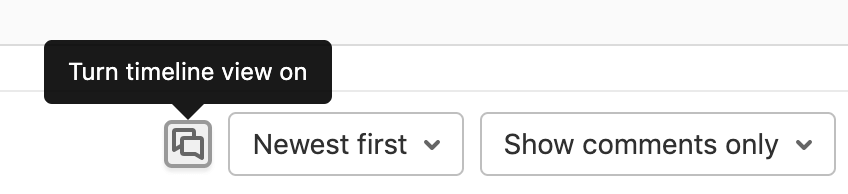
Timeline view
Introduced in GitLab Premium 13.5.
To quickly see the latest updates on an incident, click Turn timeline view on in the comment bar to display comments un-threaded and ordered chronologically, newest to oldest:
Service Level Agreement countdown timer
Introduced in GitLab Premium 13.5.
You can enable the Service Level Agreement Countdown timer on incidents to track the Service Level Agreements (SLAs) you hold with your customers. The timer is automatically started when the incident is created, and shows the time remaining before the SLA period expires. The timer is also dynamically updated every 15 minutes so you do not have to refresh the page to see the time remaining. To configure the timer:
- Navigate to Settings > Monitor.
- Scroll to Incidents and click Expand, then select the Incident settings tab.
- Select Activate “time to SLA” countdown timer.
- Set a time limit in increments of 15 minutes.
- Click Save changes.
After you enable the SLA countdown timer, the Time to SLA attribute is displayed
as a column in the Incidents List, and as a field on newly created Incidents. If
the incident isn’t closed before the SLA period ends, GitLab adds a missed::SLA
label to the incident.
Incident Actions
There are different actions available to help triage and respond to incidents.
Assign incidents
Assign incidents to users that are actively responding. Select Edit in the right-hand side bar to select or deselect assignees.
Associate a milestone
Associate an incident to a milestone by selecting Edit next to the milestone feature in the right-hand side bar.
Change severity
See Incident List for a full description of the severity levels available. Select Edit in the right-hand side bar to change the severity of an incident.
Add a to-do item
Add a to-do for incidents that you want to track in your to-do list. Click the Add a to do button at the top of the right-hand side bar to add a to-do item.
Manage incidents from Slack
Slack slash commands allow you to control GitLab and view GitLab content without leaving Slack.
Learn how to set up Slack slash commands and how to use the available slash commands.
Associate Zoom calls
GitLab enables you to associate a Zoom meeting with an issue for synchronous communication during incident management. After starting a Zoom call for an incident, you can associate the conference call with an issue. Your team members can join the Zoom call without requesting a link.
Embed metrics in incidents
You can embed metrics anywhere GitLab Markdown is used, such as descriptions, comments on issues, and merge requests. Embedding metrics helps you share them when discussing incidents or performance issues. You can output the dashboard directly into any issue, merge request, epic, or any other Markdown text field in GitLab by copying and pasting the link to the metrics dashboard.
You can embed both GitLab-hosted metrics and Grafana metrics in incidents and issue templates.
Automatically close incidents via recovery alerts
- Introduced for Prometheus Integrations in GitLab 12.5.
- Introduced for HTTP Integrations in GitLab 13.4.
With Maintainer or higher permissions, you can enable GitLab to close an incident automatically when a Recovery Alert is received:
- Navigate to Settings > Monitor > Incidents and expand Incidents.
- Check the Automatically close associated Incident checkbox.
- Click Save changes.
When GitLab receives a Recovery Alert, it closes the associated incident. This action is recorded as a system message on the incident indicating that it was closed automatically by the GitLab Alert bot.